Python matplotlib 绘制散点图/柱状图
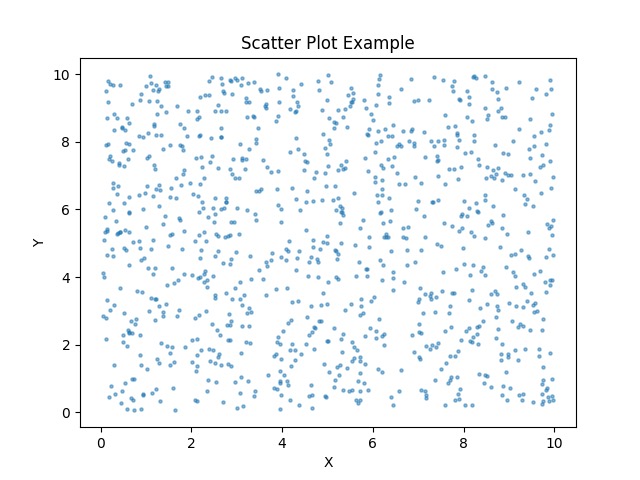
0x01 散点图

import matplotlib.pyplot as plt
import random

# 生成数据
num_points = 1000
x = [random.uniform(0, 10) for i in range(1000)]
y = [random.uniform(0, 10) for i in range(1000)]

# 绘制散点图
plt.scatter(x, y, s=5, alpha=0.5)

# 添加标题和标签
plt.title('Scatter Plot Example')
plt.xlabel('X')
plt.ylabel('Y')
# 显示图形
plt.show()
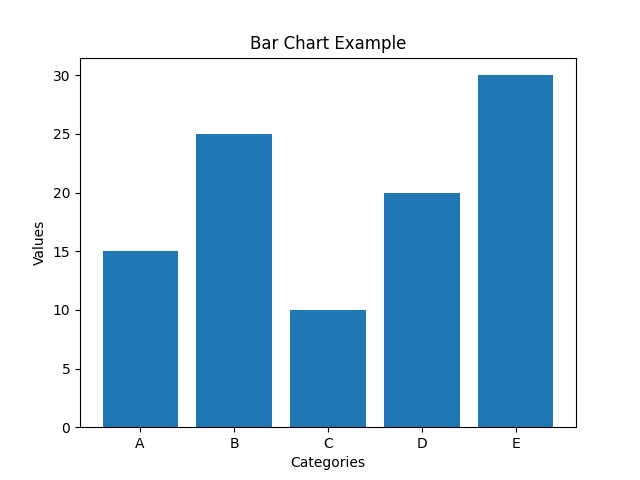
0x02 柱状图

import matplotlib.pyplot as plt

# 柱状图的数据
categories = ['A', 'B', 'C', 'D', 'E']
values = [15, 25, 10, 20, 30]

# 创建一个新的图形
fig, ax = plt.subplots()

# 绘制柱状图
ax.bar(categories, values)

# 设置图形的标签和标题
ax.set_xlabel('Categories')
ax.set_ylabel('Values')
ax.set_title('Bar Chart Example')

# 显示图形
plt.show()
0x03 其他
其他示例可以参考官网
https://matplotlib.org/stable/plot_types/basic/index.html