Python numpy 生成随机数组(正态分布与均匀分布)
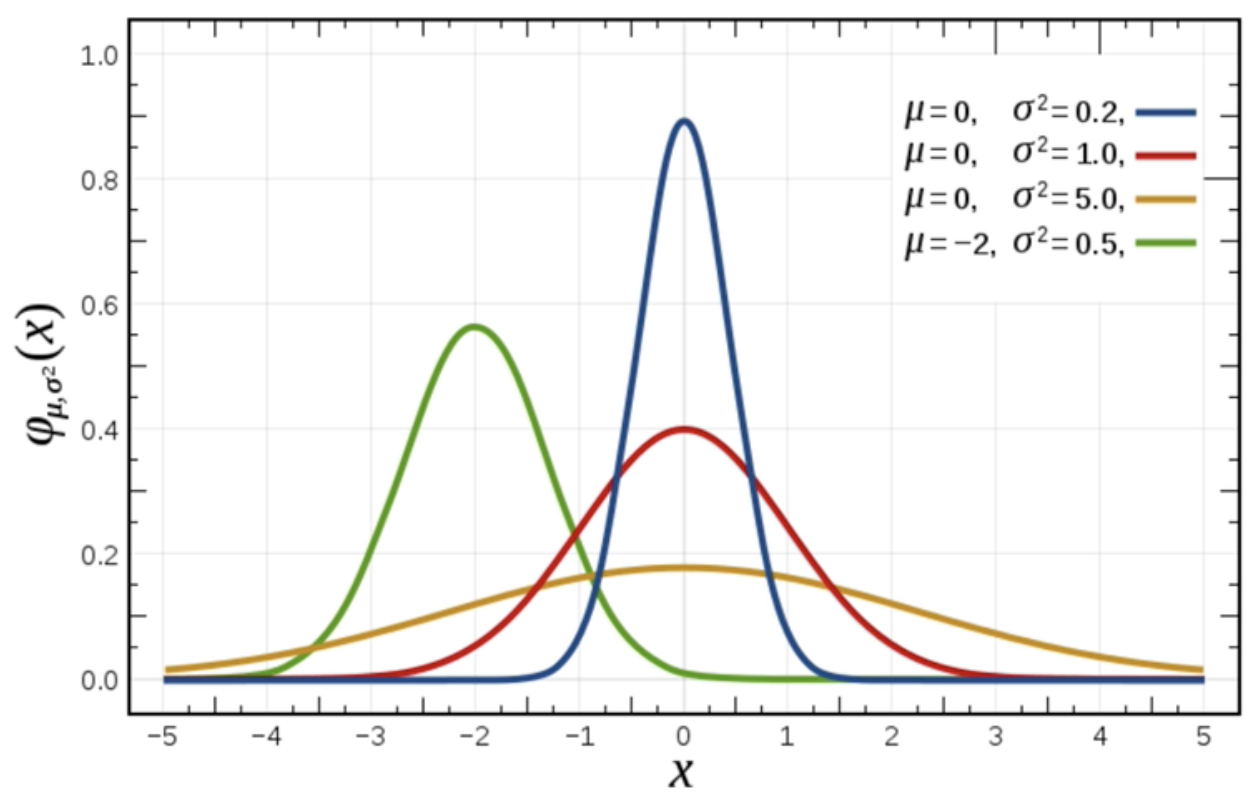
0x01 什么是正态分布
正态分布是一种概率分布。正态分布是具有两个参数u和o的连续型随机变量的分布,第一参数u是服从正态分布的随机变量的均值,第二个参数o是此随机变量的方差,所以正态分布记作N(μ,σ)。

0x02 生成正态分布的随机数组

import numpy as np
import matplotlib.pyplot as plt

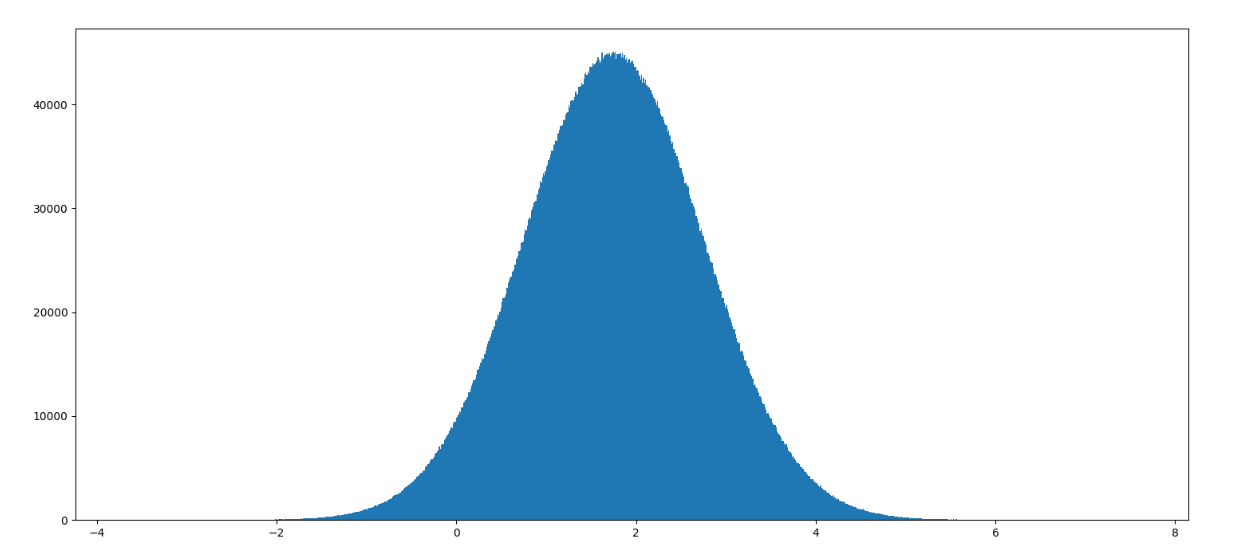
# 生成均值为1.75,标准差为1的正态分布数据,100000000个
x1 = np.random.normal(1.75, 1, 10000000)
# 绘图
plt.figure(figsize=(18, 8), dpi=100)  # 创建画布
plt.hist(x1, 1000)  # 绘制直方图
plt.show()  # 显示图像
0x03 生成均匀分布的随机数组

import numpy as np
import matplotlib.pyplot as plt

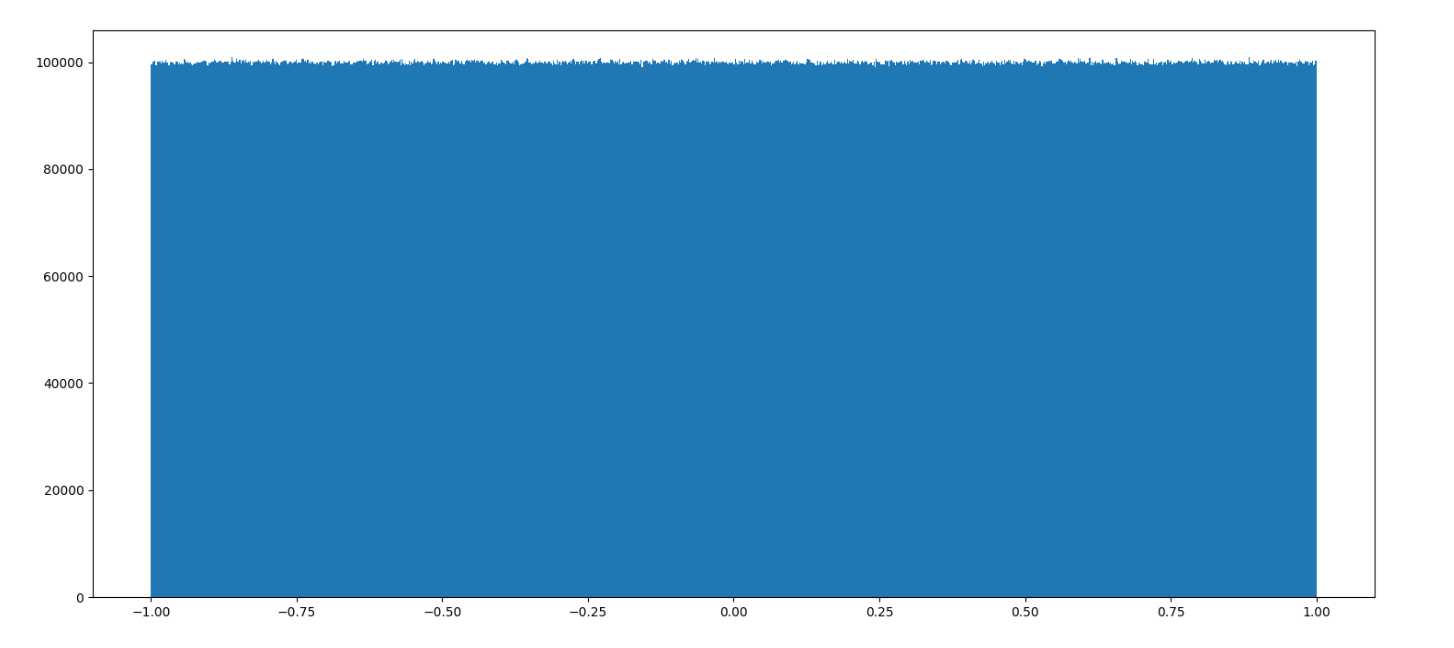
# 生成均匀分布的随机数,最低-1最高1,100000000个
x2 = np.random.uniform(-1, 1, 100000000)
plt.figure(figsize=(18, 8), dpi=100)  # 创建画布
plt.hist(x2, 1000)  # 绘制直方图
plt.show()  # 显示图像